
A dozen tools, and no single picture
If you lead a data and analytics team — say a dozen analysts — you already know the shape of the problem. Everyone’s work is tracked somewhere: a use case here, a dashboard there, a workflow in a tool only one person really understands. Individually it’s fine. But step back and ask the leadership questions — What does the whole team’s work add up to? Which platforms are actually earning their keep? What would break if we retired one? — and there’s usually no single place that answers them.
That gap is exactly what Architecture & Value closes. It’s a leadership view, reserved for you as the workspace admin, that rolls your team’s entire estate into one picture — built from the work they already track in MyDataWork.
Built from what you already have — nothing intrusive
There’s no new data collection and no questionnaire. Architecture & Value reads the use cases, tools, recorded value, and links your team already maintains, and aggregates them. It never surfaces individual titles, owners, or cost data — only rolled-up value and utilization. And it’s fully deterministic: the same inputs always produce the same picture, so it costs zero AI credits and there’s nothing to second-guess.
Four lenses on the same estate
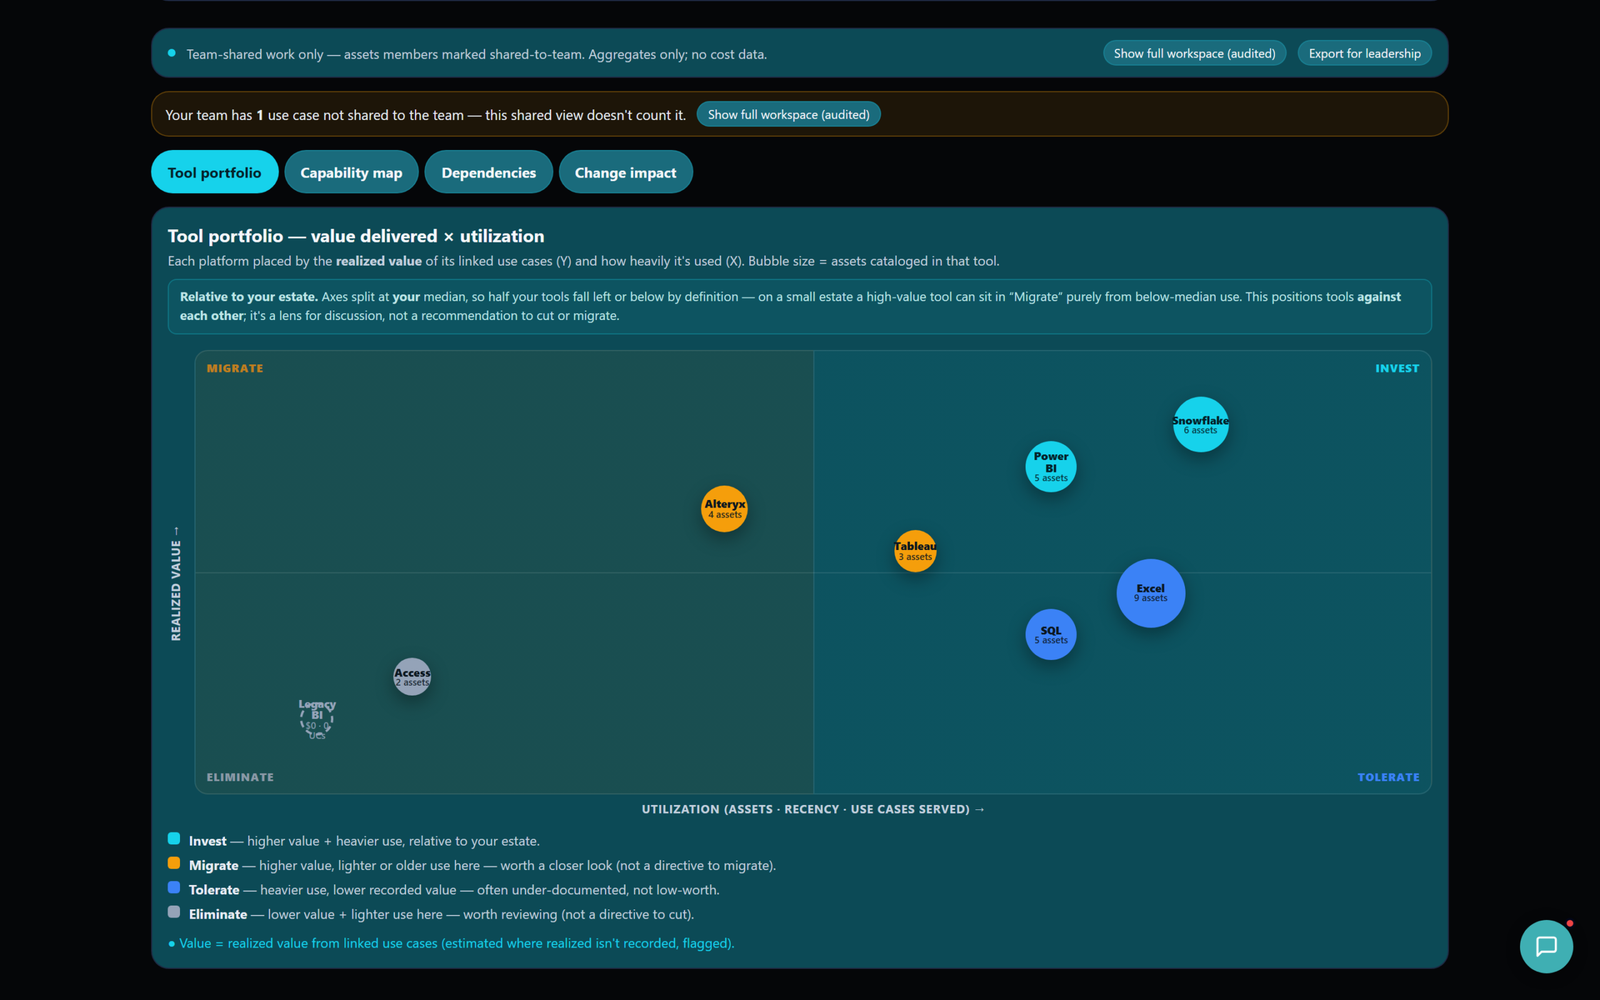
1. Tool portfolio — value × utilization
Every platform is placed by the realized value of its linked use cases against how heavily it’s used, on a familiar Invest / Migrate / Tolerate / Eliminate quadrant. Crucially, the axes split at your estate’s median — so this positions your tools against each other. It’s a lens for discussion, not a directive to cut or migrate anything.
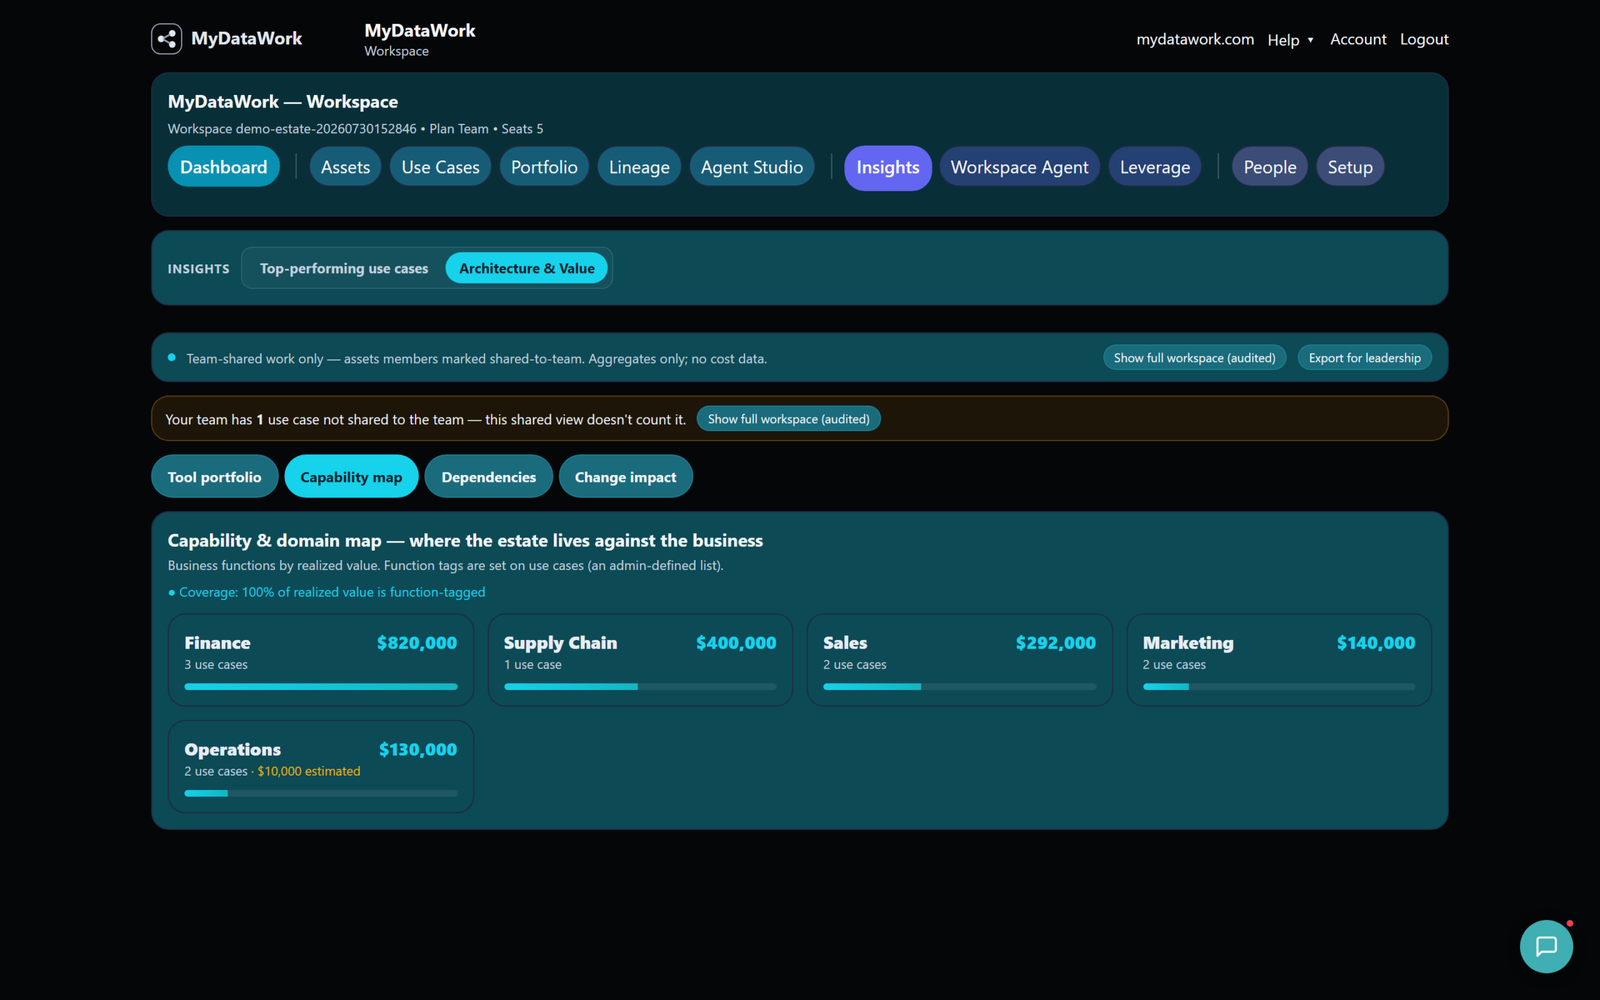
2. Capability map — value by business function
The same value, rolled up by business function — Finance, Supply Chain, Sales, and so on — so you can see where the estate actually delivers. A coverage figure shows how much of your value is function-tagged, and anything still untagged is called out honestly rather than hidden.
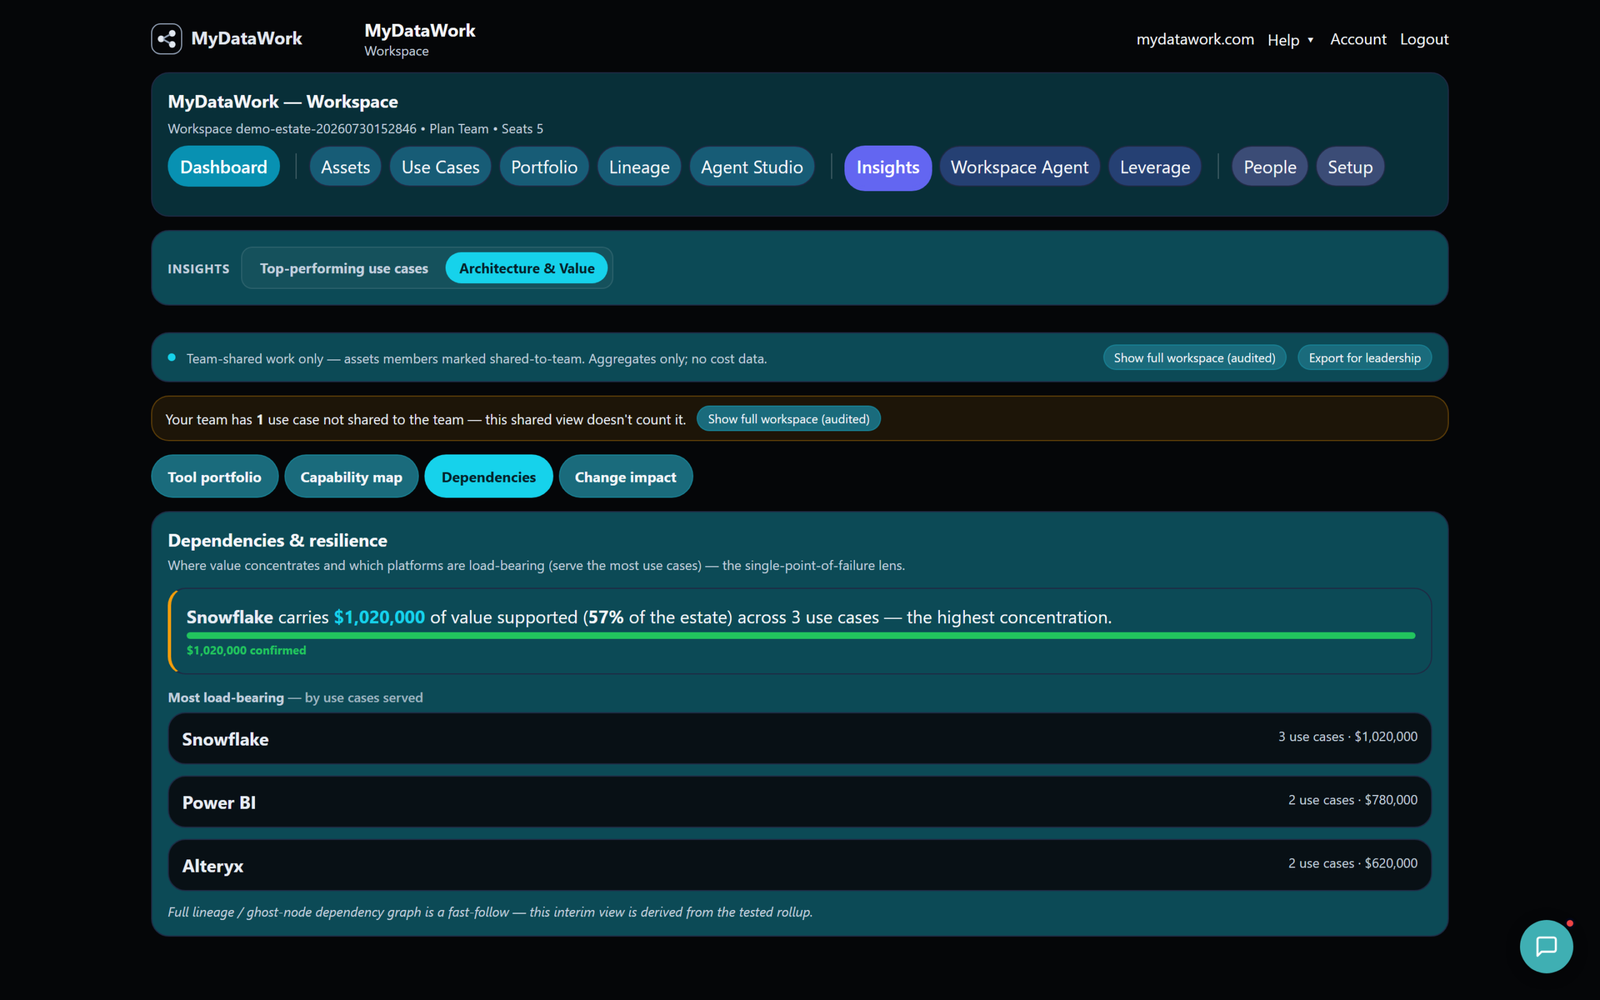
3. Dependencies & resilience
Where does value concentrate, and which platforms are load-bearing? This lens surfaces your single points of failure — the tools the most value quietly depends on — before anything breaks.
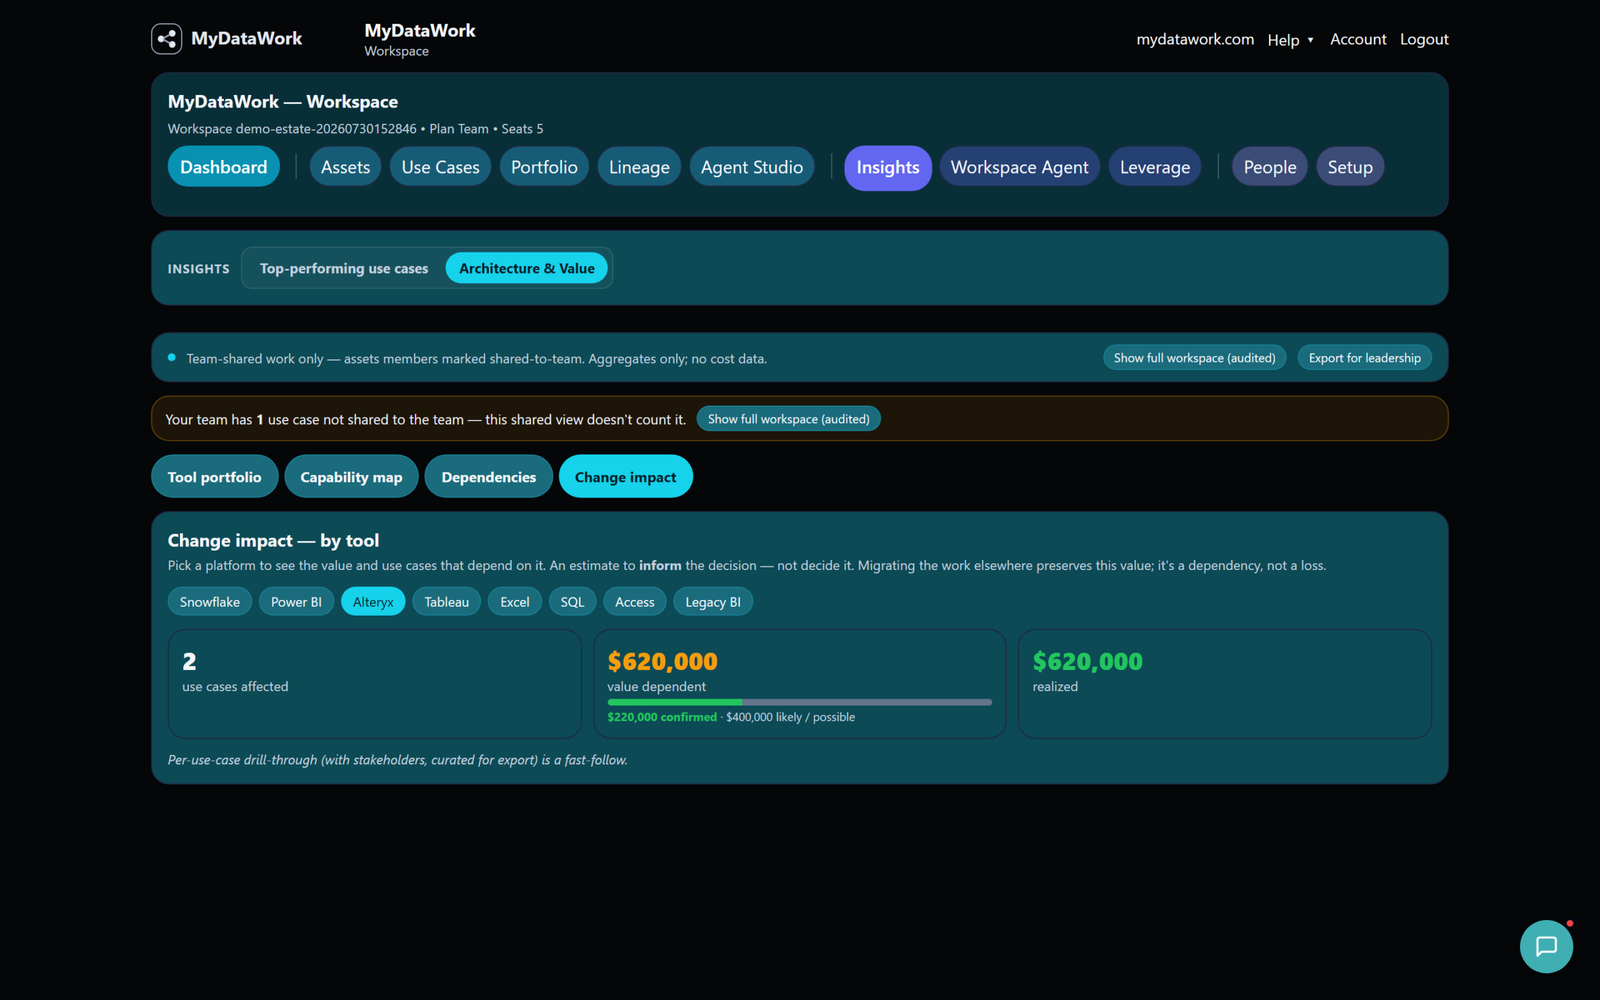
4. Change impact — by tool
Pick any platform and see the value and use cases that depend on it, split by confidence. It’s an estimate to inform a change, not decide it — and it’s framed the right way round: moving that work elsewhere preserves the value. It’s a dependency, not a loss.
Private by default, aggregate always
Architecture & Value respects the same privacy model as the rest of MyDataWork. By default it shows only work your team has shared. As the admin, you can open the fuller workspace view to include everyone’s work — including what hasn’t been shared — always as aggregates, and every time you do, it’s logged. Either way you only ever see totals: value and utilization, never titles, owners, or cost. The work itself is never shown.
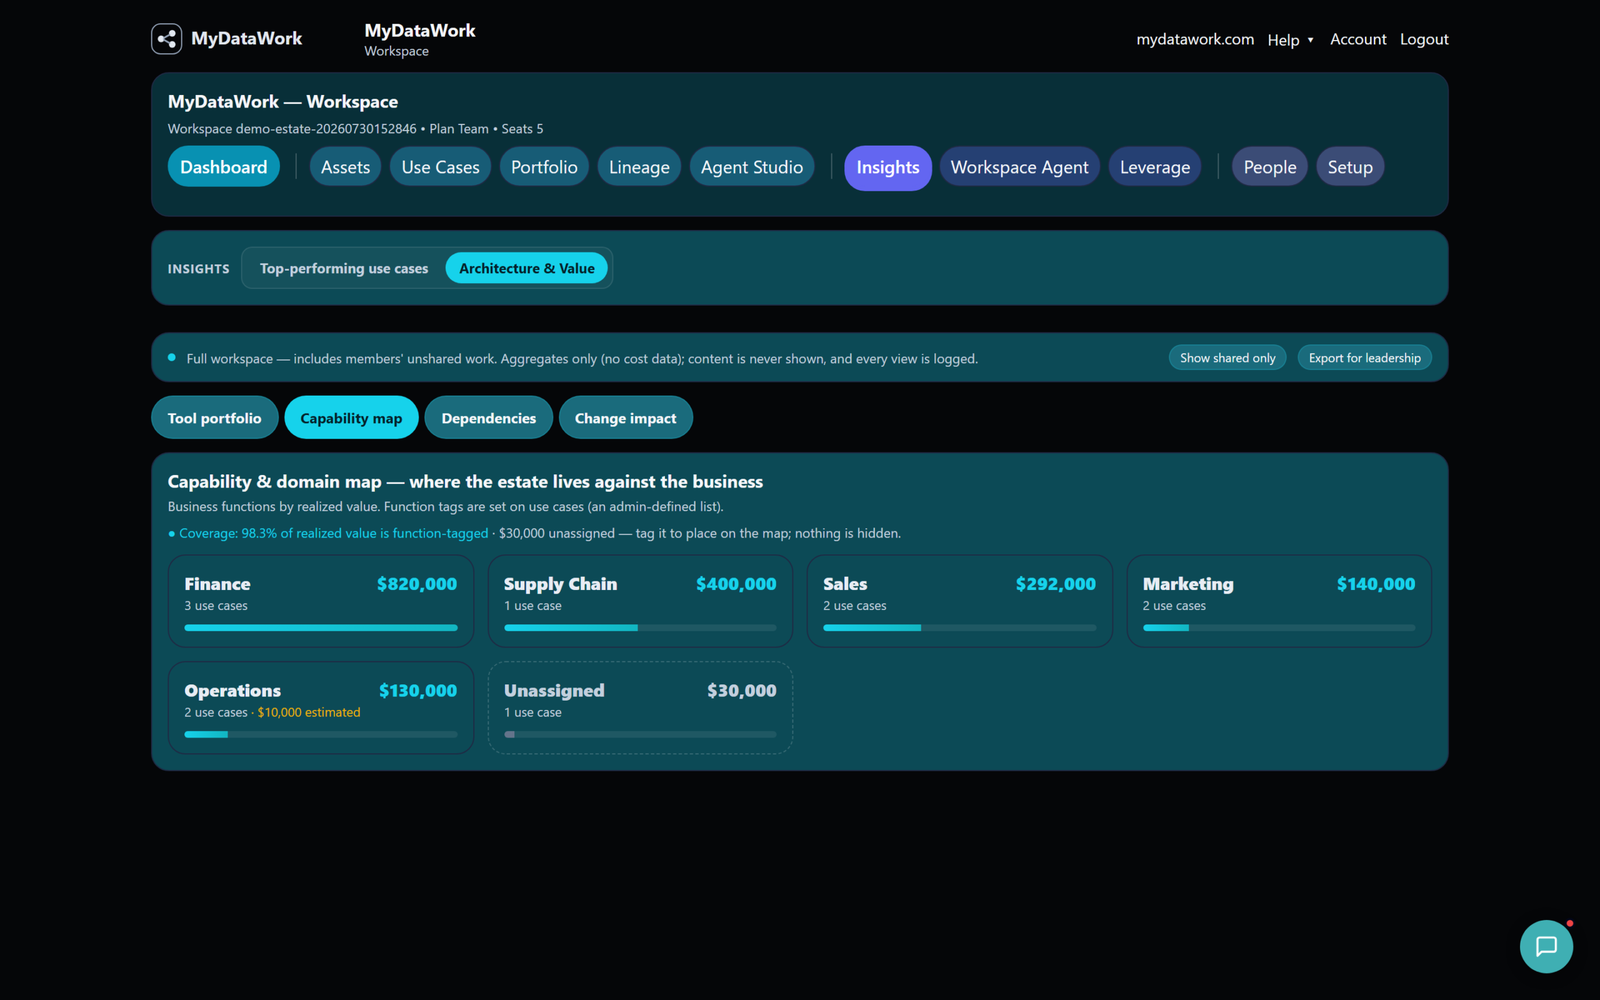
Most mid-market analytics teams don’t have an enterprise-architecture tool — and even those that do rarely capture value. Architecture & Value gives the leader that picture from the work the team is already doing.
Export for leadership
Any view exports to a leadership-ready PowerPoint deck, with the confidence and no-cost caveats carried onto every slide — so the picture you present is the same one the product computed, honestly labeled. It’s decision support that complements the enterprise-architecture and finance tools you may already run, and for many teams, the only place this picture exists at all.
